
Every year, Ofcom’s Online Nation report gives the clearest picture available of UK social media use. It dives into things like who’s on which platform, how often they’re using it, and how much time they spend on the platforms. But the thing about social media statistics is that they can look incredibly precise while still being very easy to misinterpret.
Plenty of businesses use this data to decide on strategies, using the numbers to determine what platforms they should spend their time on and how much budget they should put into various marketing activities. But something we see time and time again when these decisions are being made is how reach and time spent often get folded into a single “this platform matters” judgement, when they’re answering two different questions.
And of those two questions, neither one answers the question that really matters: Does any of it lead to a sale?
This article breaks down what the latest Ofcom figures show about UK social media use, why reach and time spent need to be read separately rather than together, and where the gap sits between attention and buying behaviour.
Reach vs Time Spent: Why They’re Not the Same Metric
Before looking at any platform-specific numbers, it’s worth being precise about what each measure actually captures, because brands routinely conflate the two when making big decisions that can influence the success of a strategy.
What Reach Measures
Reach, as Ofcom defines it in their report, is simply how many people visited a platform at least once in each month (or day, for Daily Reach). It answers, “how many people could this brand reach here,” and nothing more.
A platform can have enormous reach built almost entirely on brief, infrequent visits, which is exactly what’s happening with some of the UK’s fastest-growing platforms right now.
Something to keep in mind for this report – and article – specifically is that the marketing definition of reach is not the same as how Ofcom defines it. Ofcom’s reach isn’t the reach you’ll see in your own analytics dashboard. For the report, reach measures how many UK adults visited a platform at all in a month – audience size, not who saw a specific post. That distinction matters for how you read every figure that follows.
What Time Spent Measures
Time spent measures the average number of minutes a visitor gives a platform per day. It’s a proxy for attention and habit, not popularity.
A platform with modest reach but high time spent is commanding deep engagement from a smaller group, while a platform with huge reach and low time spent is being visited briefly by almost everyone.
Both are valid strategies for a brand, but they call for completely different content and completely different expectations.
The UK’s Social Media Landscape
Okay, now that we understand how Ofcom are using those two metrics, we can look at the UK-specific social media statistics outlined in the report.
Below we’ll look at each of the top-level social media statistics in isolation, explore the data, and then look at what this means for brands, strategies, and user buying behaviour.
94% of UK online adults used YouTube in May 2025
YouTube was the most-used social media service in the UK in Ofcom’s 2025 data, reaching 94% of UK adult internet users in May 2025. According to Statista’s UK Internet Usage data, around 55 million adults use the Internet each day. This would then mean that, considering Ofcom’s 94% figure, about 51 million adults in the UK used YouTube in May 2025.
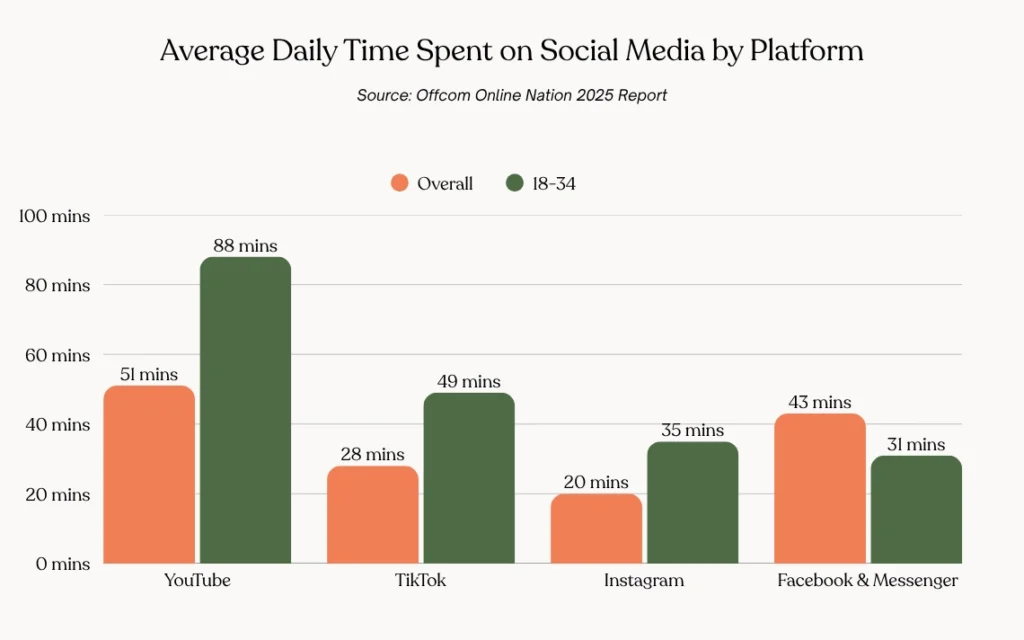
Ofcom reports that YouTube had the highest average daily time spent among the social platforms covered, at 51 minutes per day, up from 47 minutes in 2024. Importantly, this figure covers usage on smartphones, tablets, and computers, but does not include YouTube viewing on TV sets.
That 51-minute figure can look surprisingly low given how ubiquitous YouTube is. The reason is partly methodological: Ofcom’s Online Nation figure excludes YouTube viewed on television sets. Separate Ofcom research found that people spent a further 19 minutes a day watching YouTube on TV sets in 2025.
That gives us two useful numbers, but they tell us different things.
The 94% figure tells us about the size of YouTube’s audience; the 51-minute figure tells us that people who use the service are spending a substantial amount of time there. However, something to keep in mind (both for this statistic and for the stats later in the article) is that these are average numbers.
51 minutes may feel like a small amount of time for people to spend on YouTube, but we must keep in mind that it’s all average. To illustrate the point, according to the same data, 18–34-year-olds spend an average of 88 minutes on YouTube, whereas people in the 55+ age range spend 28 minutes on the platform.
When interpreting large swathes of data like this, it’s essential to understand that if you’re using it to determine which platforms to use, you need to go as niche as possible. You may find (like the YouTube example here) that whilst the averages are high, your particular demographic isn’t using a platform as much as it may seem.
And additionally, neither of these figures tells us why someone is using the platform.
People might be watching a 30-minute documentary, a five-minute tutorial, a music video, a product review, or a series of Shorts. Those are very different behaviours from a marketing perspective, despite all contributing to the same platform-level time-spent figure.
What Does This Mean for Brands?
YouTube’s combination of broad reach and high time spent makes it particularly useful for thinking about both scale and attention.
But brands shouldn’t jump from that to “YouTube is where we should spend our budget.”
The Ofcom data tells you that a large proportion of UK internet users are on YouTube and that they spend significant time there. It doesn’t tell you whether they’re interested in your product, whether they’ll notice your content, or whether they’ll buy from you.
Those questions need to be answered with your own audience, campaign, and conversion data. Or from a social media agency that specialises in deep brand research.
93% of UK online adults used Facebook and Messenger in May 2025
Facebook and Messenger remained the second most-used social service, reaching 93% of UK online adults in May 2025, with users spending an average of 43 minutes per day on the service.
An important point to note here is that Ofcom reports both Facebook and Messenger data together, whilst leaving Instagram separate (see below). Something else to keep in mind is that a platform with a huge overall audience may be less useful to a particular brand than a smaller platform whose users more closely match its target customers.
What Does This Mean for Brands?
On the surface, the 93% figure can look very appealing, but it’s not necessarily enough data to base a whole social media strategy on.
For example, a B2B brand looking to target professionals would likely see better results on LinkedIn, despite the platform having fewer monthly users than Facebook/Messenger (around 74.7% of the UK population). This is what we mean when we say that data shouldn’t be taken at face value, and that you should use platforms based on your specific needs. LinkedIn has a known business-centric user base, which is why it’s the go-to for many B2B brands.
If you’re looking to reach as many people as possible, it’s great to use platforms with high user counts. But if you want the people you’re reaching to be interested in your brand, product, or service, then being more selective in your platforms is the way to go.
Instagram reaches a large audience, but average daily time spent is 20 minutes.
Instagram was the third highest-reaching social media service in Ofcom’s data, with users spending an average of 20 minutes per day on the platform. If we’re looking purely at numbers alone, this is less than half the average daily time spent on YouTube.
At first glance, it’s tempting to read that as evidence that Instagram commands less attention, but that’s not necessarily what the number means.
Average time spent is an aggregate figure, and it doesn’t tell us how those 20 minutes are distributed between different users or what happens during them. Someone might spend 20 minutes scrolling Reels. Someone else might spend five minutes checking Stories and another 15 minutes messaging. Another user might open Instagram specifically to look at a brand or product.
All three contribute to the platform’s overall usage data.
It’s here that we, once more, must factor in how averages work. If we look at Ofcom’s own data, we can see that 18–34-year-olds (just like YouTube) by far out-scroll their demographic peers, with them spending 35 minutes a day on the platform, whereas the lowest demographic is 55+ year olds, with them only spending 8 minutes on Instagram.
What Does This Mean for Brands?
Time spent can tell you something about the amount of attention a platform commands, but it doesn’t tell you the quality or commercial value of that attention.
That’s particularly important when comparing platforms.
A platform with 20 minutes of average daily usage isn’t automatically less valuable than one with 50 minutes. If the people using those 20 minutes are highly relevant to your brand and are actively researching products, the shorter average session could still be commercially meaningful.
This is something that can only come from your own audience insight. Using broad data is super helpful for certain things, but when it comes down to building a whole social media strategy, it’s less helpful than it may initially be on the surface.
Conclusion
The value of Ofcom’s Online Nation data isn’t that it tells brands exactly where they should spend their money. It can’t do that.
What it can do, though, is give you a useful picture of the wider UK digital landscape. It can show you which platforms have the broadest reach, where people are spending the most time, how behaviour differs between age groups, and how those patterns are changing over time.
But there’s a big gap between being on a platform and buying from a brand on it.
A platform can have millions of users and still be a poor fit for a particular audience. Another might have a smaller overall audience but contain a much higher concentration of the people a brand actually wants to reach. Even then, reaching the right people doesn’t guarantee they’ll pay attention, engage with the content, or eventually become customers.
That’s why the most useful way to approach data like this is to treat it as a starting point, not a strategy.
Use Ofcom’s figures to understand the market. Use your own audience data to understand your customers. Use campaign and conversion data to understand what drives results.
And, perhaps most importantly, don’t let a single number make the decision for you. That’s the gap between understanding social media usage and understanding social media performance.
At Giraffe Social, we build social media strategies based on deep platform and audience understanding, taking into account demographics, audience interests and passions, and much more. If you’re looking to build a social media strategy on more than just top-level platform data, get in touch today.