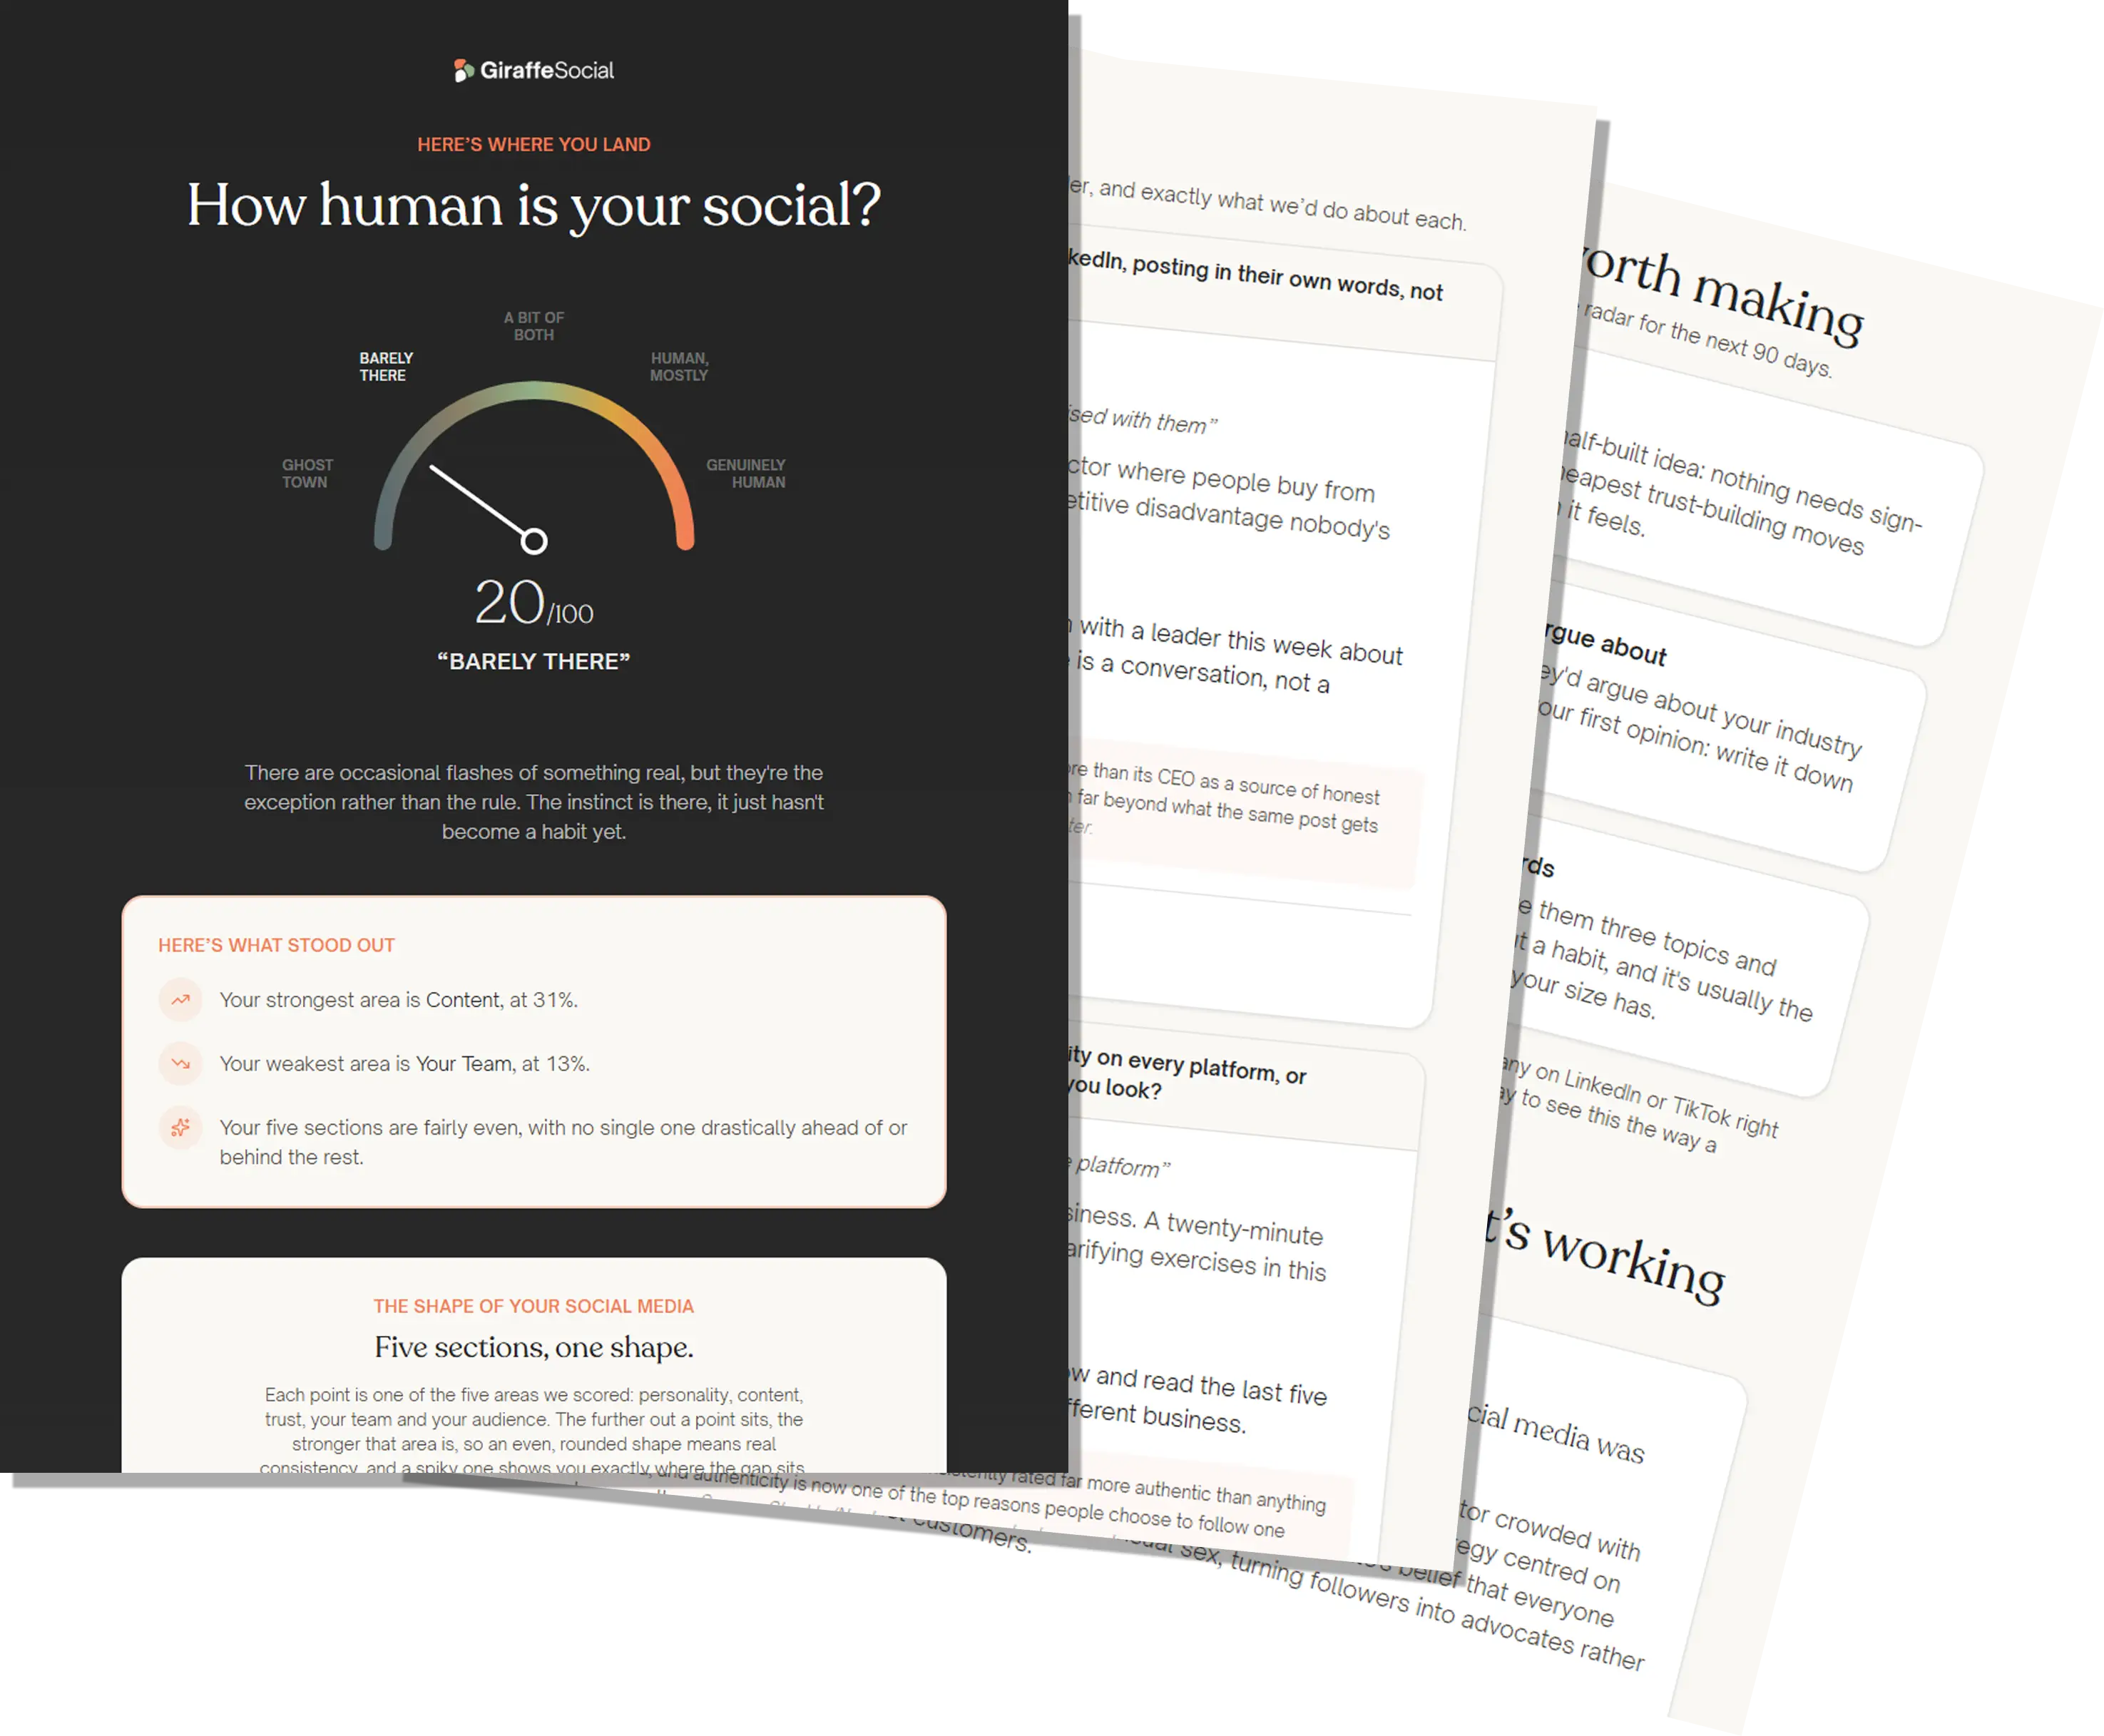


When you create or receive your benchmarking report, the amount of data and information can be overwhelming. But once you know how to interpret it, it can be one of the most powerful tools. A good marketing report isn’t just data, it’s direction. The report should tell you where you stand, what is working, and what isn’t.
The challenge is knowing how to properly interpret it.
As marketers, we are told that data should be used to guide everything that we do, but often, we’re left with incomplete pictures, constant industry changes, and the growing pressure of trying to gain more for less budget.
If you’ve ever been in a situation where you’re running a campaign in which you’ve put in a lot of effort, but then notice that the engagement rate is lower than that of the competition, you’ll know the stress this can cause.
What can you do in this situation? We recommend running a benchmark report. A good benchmark report will compare your results to competitors and industry standards to help identify the strengths and weaknesses of your campaign.
In this article, we’ll explore the essential insights every marketer should know, diving into the best ways to read a benchmark report so you can focus on the information that really matters.
What Is a Benchmarking Report?
Before we get into how to interpret a benchmark report, it is important to understand what it actually is and why it is such a useful tool. A benchmarking report is a document that outlines your company’s performance compared to different standards, typically these are industry standards and industry leaders.
You can also compare KPIs and business goals to optimise your business. It provides context, which helps businesses to identify areas of improvement, set goals, and develop strategies to increase efficiency. When you are able to interpret the data, you can identify strengths and weaknesses in order to improve.
Most importantly, it helps you make better business decisions, rather than making guesses, and highlights trends, gaps, and opportunities.
Key Components of a Benchmark Report
Now that you know what a benchmark report is and what it is used for, you need to know what to focus on. Not all metrics are going to be important to you; you need to prioritise the ones that meet your goals.
Engagement Metrics
Engagement metrics tell you how your audience interacts with your content, which includes likes, comments, shares, clicks, views, etc. A high engagement rate tells you that your audience likes your content. Engagement rate is also an effective metric that shows you the level of interest your social media content is getting from your followers.
Click-through rate also indicates whether your audience is interested in your content. A strong CTR shows your audience likes your content and wants to find out more, so they have clicked on the link within the post, highlighting that your call-to-action is working. A low CTR might mean your call to action isn’t clear, or your content isn’t resonating well with your audience.
There are many ways to boost engagement on social media, including with high-quality photography.
Traffic Metrics
It all starts with traffic; there is no point trying to focus on conversions and ROAS if you can’t even get traffic. Reach looks at the number of unique people you have spread your message to; this gives you a good idea of your audience size and brand awareness. A sudden drop in reach can indicate something might not be right with the targeting approach or your content.
It is common for people to get reach and impressions mixed up. Impressions refer to the total number of times your content was shown to users. It is useful in understanding how many people have seen your content. However, this can sometimes be misleading; your content may be shown to high numbers of people, but if your engagements are low, then this is irrelevant. If this is the case, then you may need to review your strategy.
Whilst high impressions are good, we want to ensure we are reaching the right audience. Impressions should help provide insights into creating engaging, relevant content that genuinely resonates with your audience, rather than just being shown to a large number of people who aren’t interested in your product or service.

Conversion Metrics
Conversions and conversion rates are one of the most important metrics for businesses; this is where the action happens. Conversion rate is a crucial metric when calculating your return on investment (ROI). When looking at your benchmark report, if your engagements are high but your conversions are low, it may indicate issues with your landing page.
You should include a clear call to action (CTA) within your content to ensure you are pushing people to convert and improve your conversion rate.
Growth Metrics
Growth metrics show you how your performance is trending over time; these metrics include follower growth, traffic increase, and revenue growth.
A strong upward trend shows your strategy is moving in the right direction and indicates good growth. Consistency may not be a bad thing, but it could be a sign to have a refresh and look at your strategy’s growth plan.

How This Improves Your Strategy
Interpretation is key; reading the report in the right way is all based on the way you interpret it. It’s important to look for patterns within the data. Benchmarks can vary depending on your industry, external factors, and audience size. A b2b marketing campaign has different benchmarks compared to a B2C campaign, so comparing the two directly rarely tells you anything useful.
You need to ensure you are comparing your data to that within your industry. If the metric drops once, it may be nothing to worry about, but if it has consistently been dropping, then this is likely an issue that needs looking into. When you know how to read a report properly, you can use it to improve your strategy.
Common Mistakes When Reading a Benchmark Report
Even experienced marketers misinterpret data from time to time. Avoiding a few common mistakes can make your analysis far more effective.
Focusing on Vanity Metrics
Whilst all metrics are useful in their own right, some are more important to focus on than others. It’s easy to get distracted by likes and impressions. While these metrics have value, they don’t always translate to business results. Metrics such as social media followers, page views or likes may look impressive on reports, but don’t always correlate to success.
To make your metrics more meaningful, you need to look at the context behind them to truly understand what is doing well. Look at the bigger picture and the overall growth, and how those metrics can impact other metrics to get the overall performance breakdown.
Comparing the Wrong Things
One of the biggest mistakes in reading a benchmark report is comparing metrics across different contexts. Different platforms work differently, some audiences are different, and different industries have different industry averages.
For example, LinkedIn has higher cost per click levels, but this doesn’t mean your campaign is performing differently. There are just different benchmarks here; LinkedIn also has a completely different audience compared to TikTok or Instagram, so comparing these two platforms won’t look the same.
Make sure you are comparing to businesses in the same industry, compare the same platforms against each other, and make sure they are a similar size business.
Overreacting to Short-Term Changes
Marketing performance fluctuates. Algorithms change, audience behaviour shifts, and campaigns take time to optimise. Try not to make any drastic decisions based on short-term changes, instead look at long-term trends and patterns before making any adjustments to your strategy.
Use Your Benchmark Report to Prove Marketing Impact
A common issue marketers have is that whilst they know their marketing is doing well and making an impact, they struggle to prove it. A benchmark report allows you to compare your performance to the industry and competitors.
It shows you where you are outperforming, where you have improved, and what has grown. You can show progress and the impact that your content is having, and use the report as evidence to make it easier to understand when presenting it to other teams in your company, such as the finance team.
Conclusion
Reading a benchmark report can be overwhelming, but once you know how to interpret and read it, it can become an extremely valuable tool. It is important not to just focus on the numbers but to look at the context. A benchmark report gives a clear picture of where you are, where efforts matter the most to help you make better strategic decisions, and refine your strategy. Benchmark reports help you decide what’s worth doing next and plan for your business’s future.
It shows you the biggest gaps and gives you clearer justification, so you can be confident in your approach.
If you’re not sure whether your current reports are giving you the clarity you need, it might be time to rethink how you approach them. And if you want help turning data into real results, working with a social media agency that lives and breathes performance marketing can make all the difference.
Need a hand with optimising your social media strategies? Get in touch with us today!